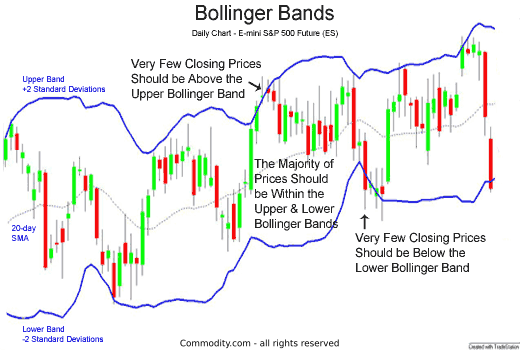
Bollinger Bands is a versatile tool combining moving averages and standard deviations and is one of the most popular technical analysis tools. There are three components to the Bollinger Band indicator:
- Moving Average: By default, a 20-period simple moving average is used.
- Upper Band: The upper band is usually 2 standard deviations (calculated from 20-periods of closing data) above the moving average.
- Lower Band: The lower band is usually 2 standard deviations below the moving average.
Bollinger Bands (in blue) are shown below in the chart of the E-mini S&P 500 Futures contract:
There are three main methodologies traders might use the Bollinger Bands for; these interpretations are discussed in the following sections:
- Playing the Bands
- Bollinger Band Breakouts
- Option Volatility Strategies
The information above is for informational and entertainment purposes only and does not constitute trading advice or a solicitation to buy or sell any stock, option, future, commodity, or forex product. Past performance is not necessarily an indication of future performance. Trading is inherently risky. OnlineTradingConcepts.com shall not be liable for any special or consequential damages that result from the use of or the inability to use, the materials and information provided by this site.
Read more at: https://commodity.com/technical-analysis/bollinger-bands/
Read more at: https://commodity.com/technical-analysis/bollinger-bands/

No comments:
Post a Comment